Add chart into presentaiton to explain better
ViewsIn Focusky, you can add charts for data visualization to help viewers understand your information better.
Focusky offers all types of charts for you to use in your presentation. These charts include bar charts, pie charts, mixed charts and so on.
1Click on the "Chart" icon
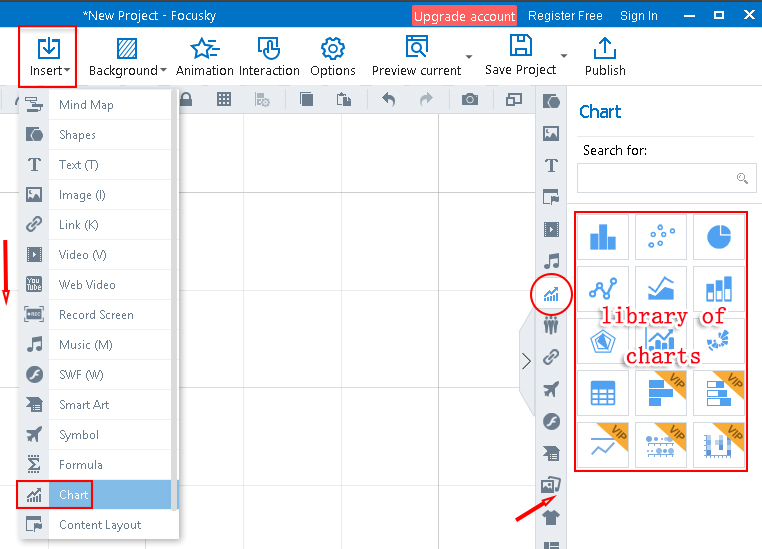
Click "Insert"--“Chart”, or click the “Chart” icon on the right-side toolbar, then you will see the library of charts.

2Add chart
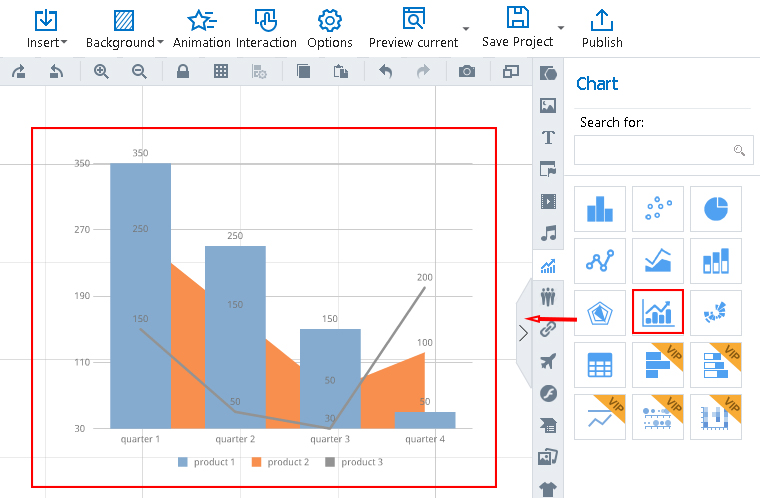
Browse through the library of charts, and drag a chart to the canvas.

3Edit chart
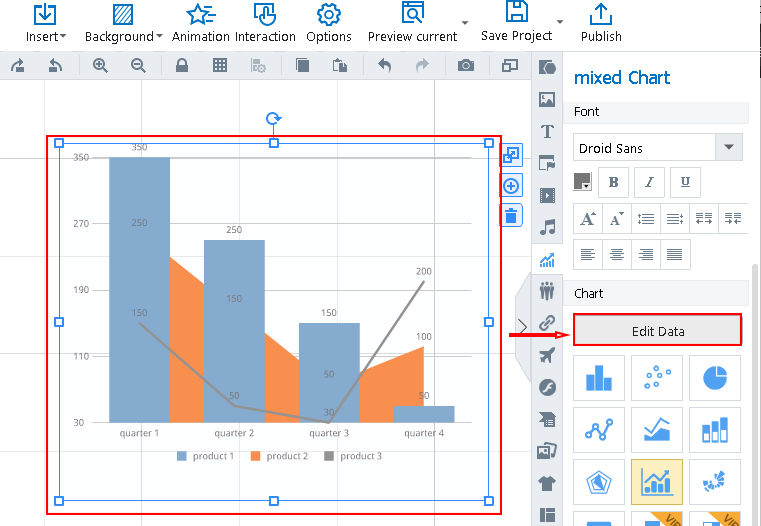
Click on the added chart—select “Edit Data” on the right-side toolbar, then you can edit the chart data according your needs.

